In the previous blog, we saw how different characteristics of the data can guide the process of automatic selection of the best control. In order to support the manager with an attractive and effective interface of the information stored in the database, intelligent graphics presentation might be employed. The process of intelligent graphics presentation is directed by five components as is depicted in the figure below.
Showing posts with label graphs. Show all posts
Showing posts with label graphs. Show all posts
Friday, September 20, 2013

Sunday, October 23, 2011
A general task model of the decision making process
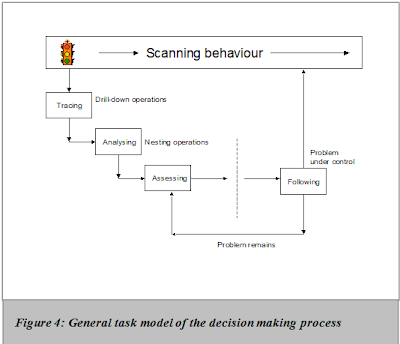
The succession of steps that managers perform when they are engaged in the intelligence phase (see Turban, 1993) using a business intelligence system, can be generalized as a set of strategies that make up a general task model of the senior manager when involved in a decision making process. This general task model of the decision making process accommodates the procedure discovered by Borgman. That procedure shows that managers are engaged initially in broad and systematic browsing (the checklist scanning approach) and focus, in a later stage, based on the results of the scan with large conceptual distances between successive queries (Borgman, 1994). This checklist scanning approach can be extended and translated into the following successive steps.
Subscribe to:
Posts (Atom)