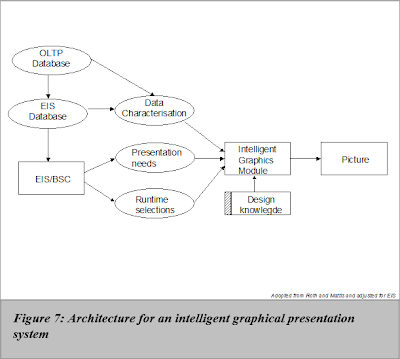
Figure 7: Architecture for an intelligent graphical presentation system
EIS databases extract data from OLTP
Significant for EIS-databases is that they extract their data from OLTP databases. In such a process, meta information for designing effective graphics will be lost. The OLTP database is modelled according to entity relation or object oriented diagrams. Multi-dimensional or star-schema techniques are regularly used to shape EIS databases, which are quite different compared to normalised OLTP databases.
Data characterization
For that reason, data characterization properties from both databases should be available to the intelligent graphics module as well as the linkage between them. A data characterisation is a description of the semantic and structural properties in a database of its information that are relevant to presentation design (Roth en Mattis, 1998b). The presentation needs (e.g. looking for deviations, correlations or accurate values) can be classified to conform to the user’s goals which are partly related to the mode of decision and level of experience of the user. Furthermore, runtime selections can influence the optimal graphical presentation. When a user has performed a drill-down, a selection operation, it influences the graphical presentation.
An intelligent graphics module
The intelligent graphics module will consider these variations in order to make inferences using the design knowledge. The design knowledge will attempt to satisfy two constraints: the expressiveness and the effectiveness of graphs. The expressiveness of a supplied set of data values will restrict the number of possible graphical presentations. The effectiveness criteria seek to select those graphs that might fit most the data characteristics and the user information seeking goals. To calculate the effectiveness the system will make use of the principle of importance ordering. Information that is more important is encoded more effectively (Mackinlay, 1986). Composition techniques will further refine and optimize a graphical presentation.
They did not consider how to render graphs dynamically
Previous research has focused primarily upon these criteria. However, they did not consider how rendered graphs could be made dynamically. Dynamic graphs are common technology in today’s state-of-the-art OLAP tools; thus, this will be a new dimension to consider. Data manipulation operations like drill-down and nesting within graphs have not yet been considered and will alter the way the intelligent graphics module will operate.
No comments:
Post a Comment